Analysis of key IT security indicators (SOC)
- Interactive Widgets
- Dashboard
- Security Dashboard
- Network Dashboard
- My Dashboard
Table of contents
Analysis of key IT security indicators (SOC)
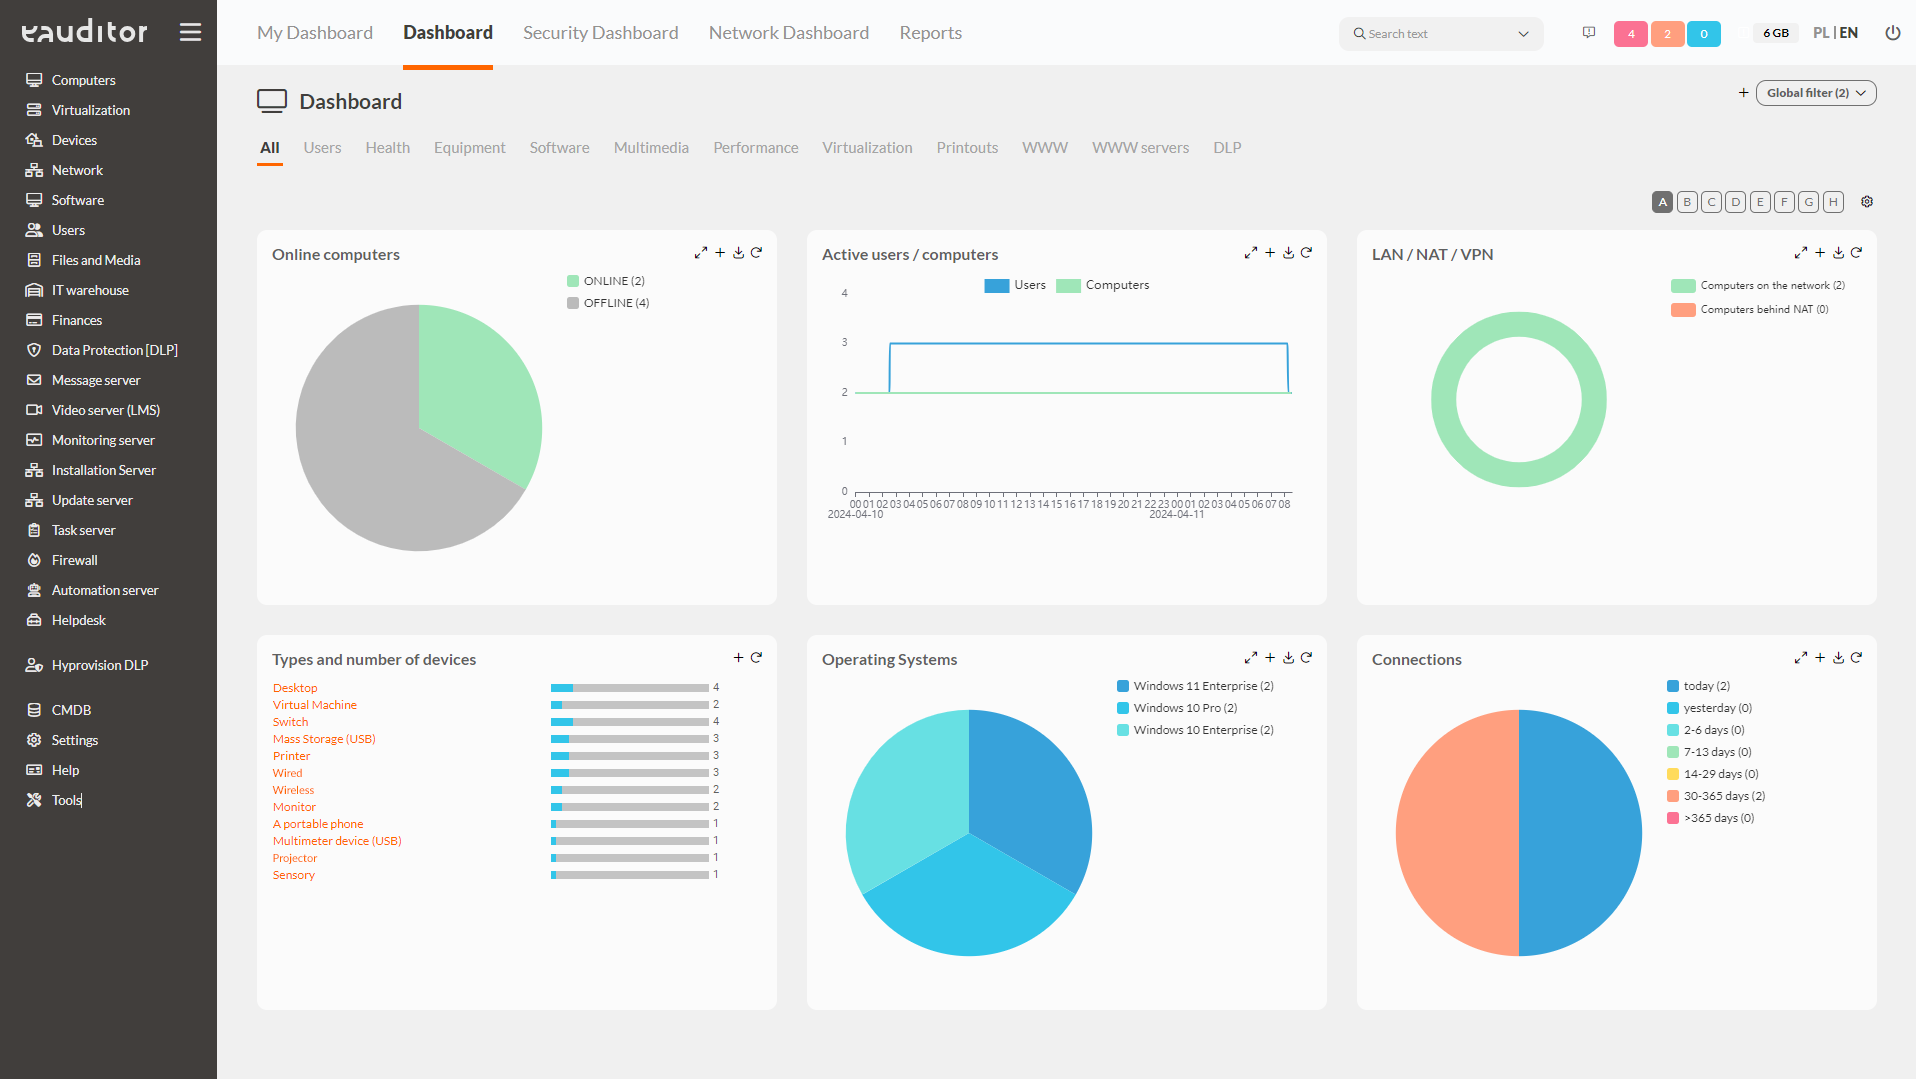
Dashboard
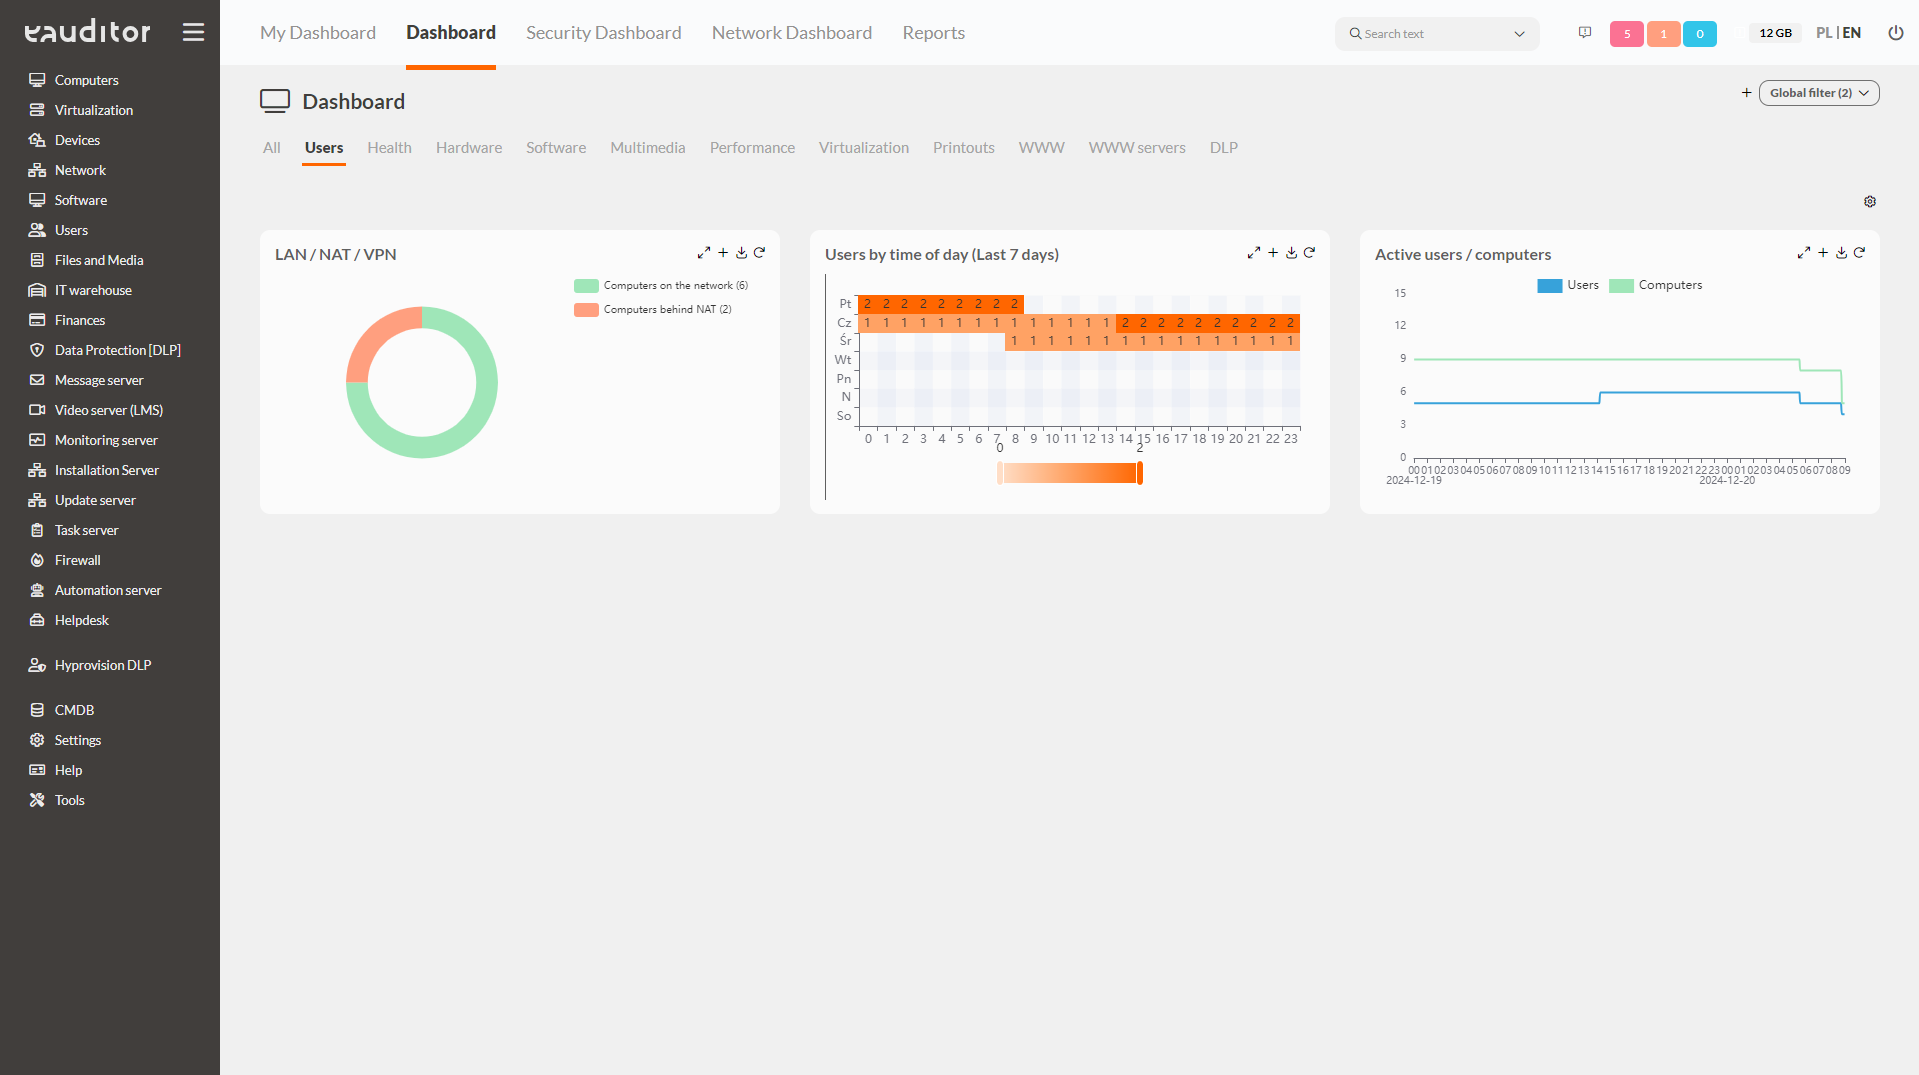
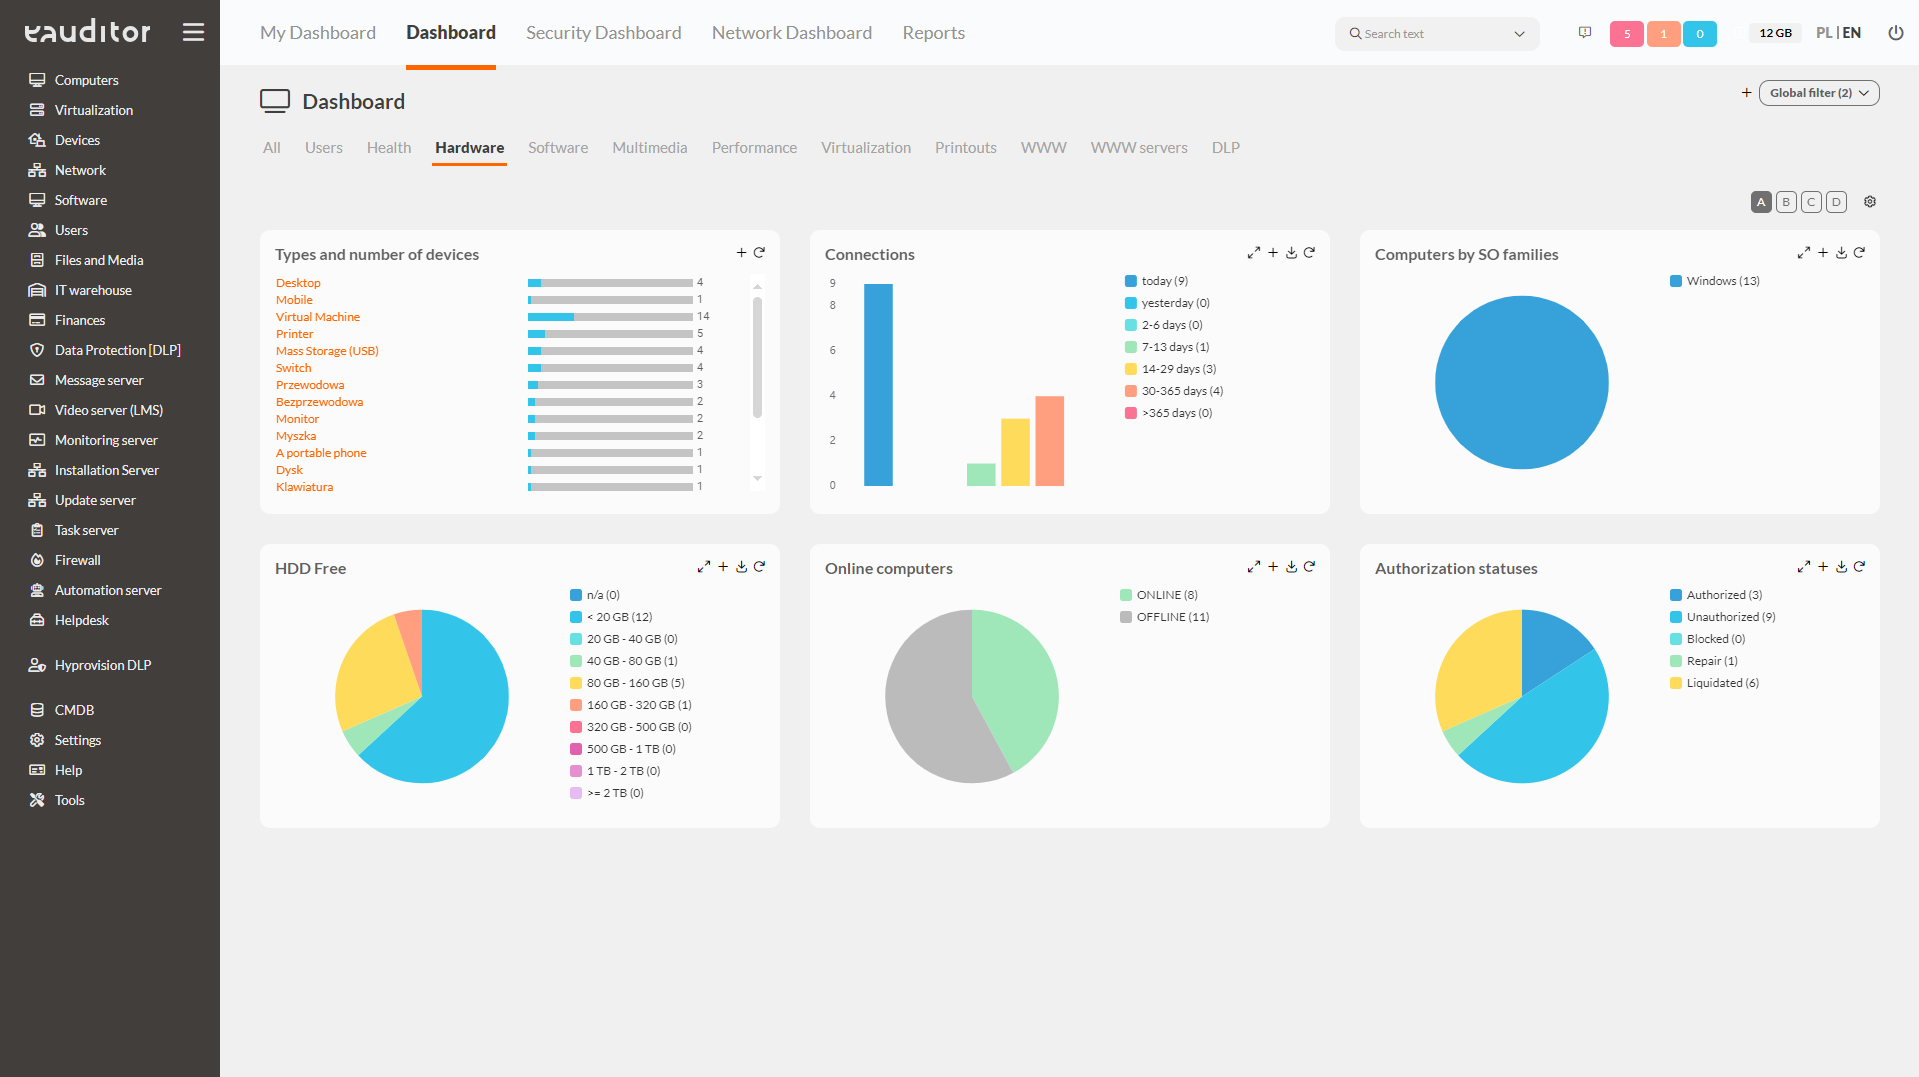
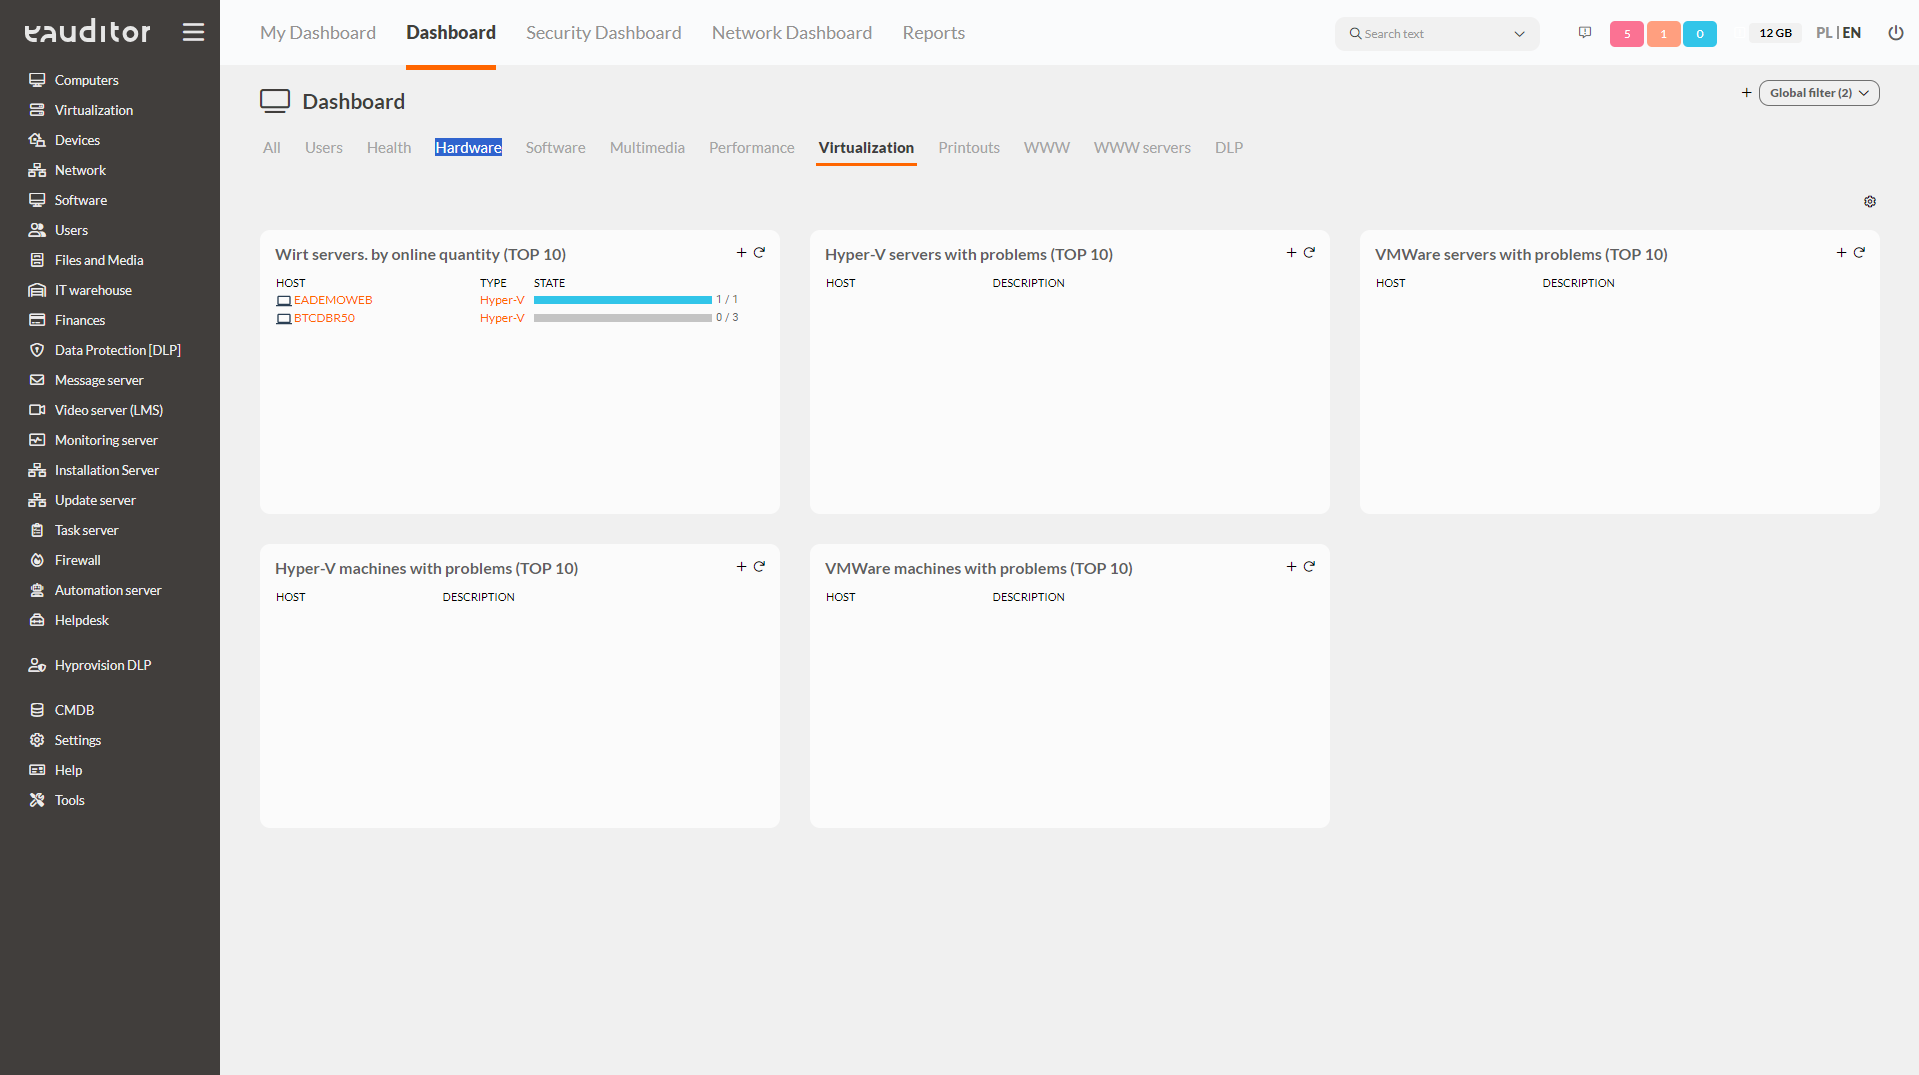
In the eAuditor system, it is possible to view interactive widgets that present data. This makes it easy and simple for administrators to read key information about the IT infrastructure. More than 200 dashboards are available in the system, grouped into 11 categories:
- People,
- Health,
- Hardware,
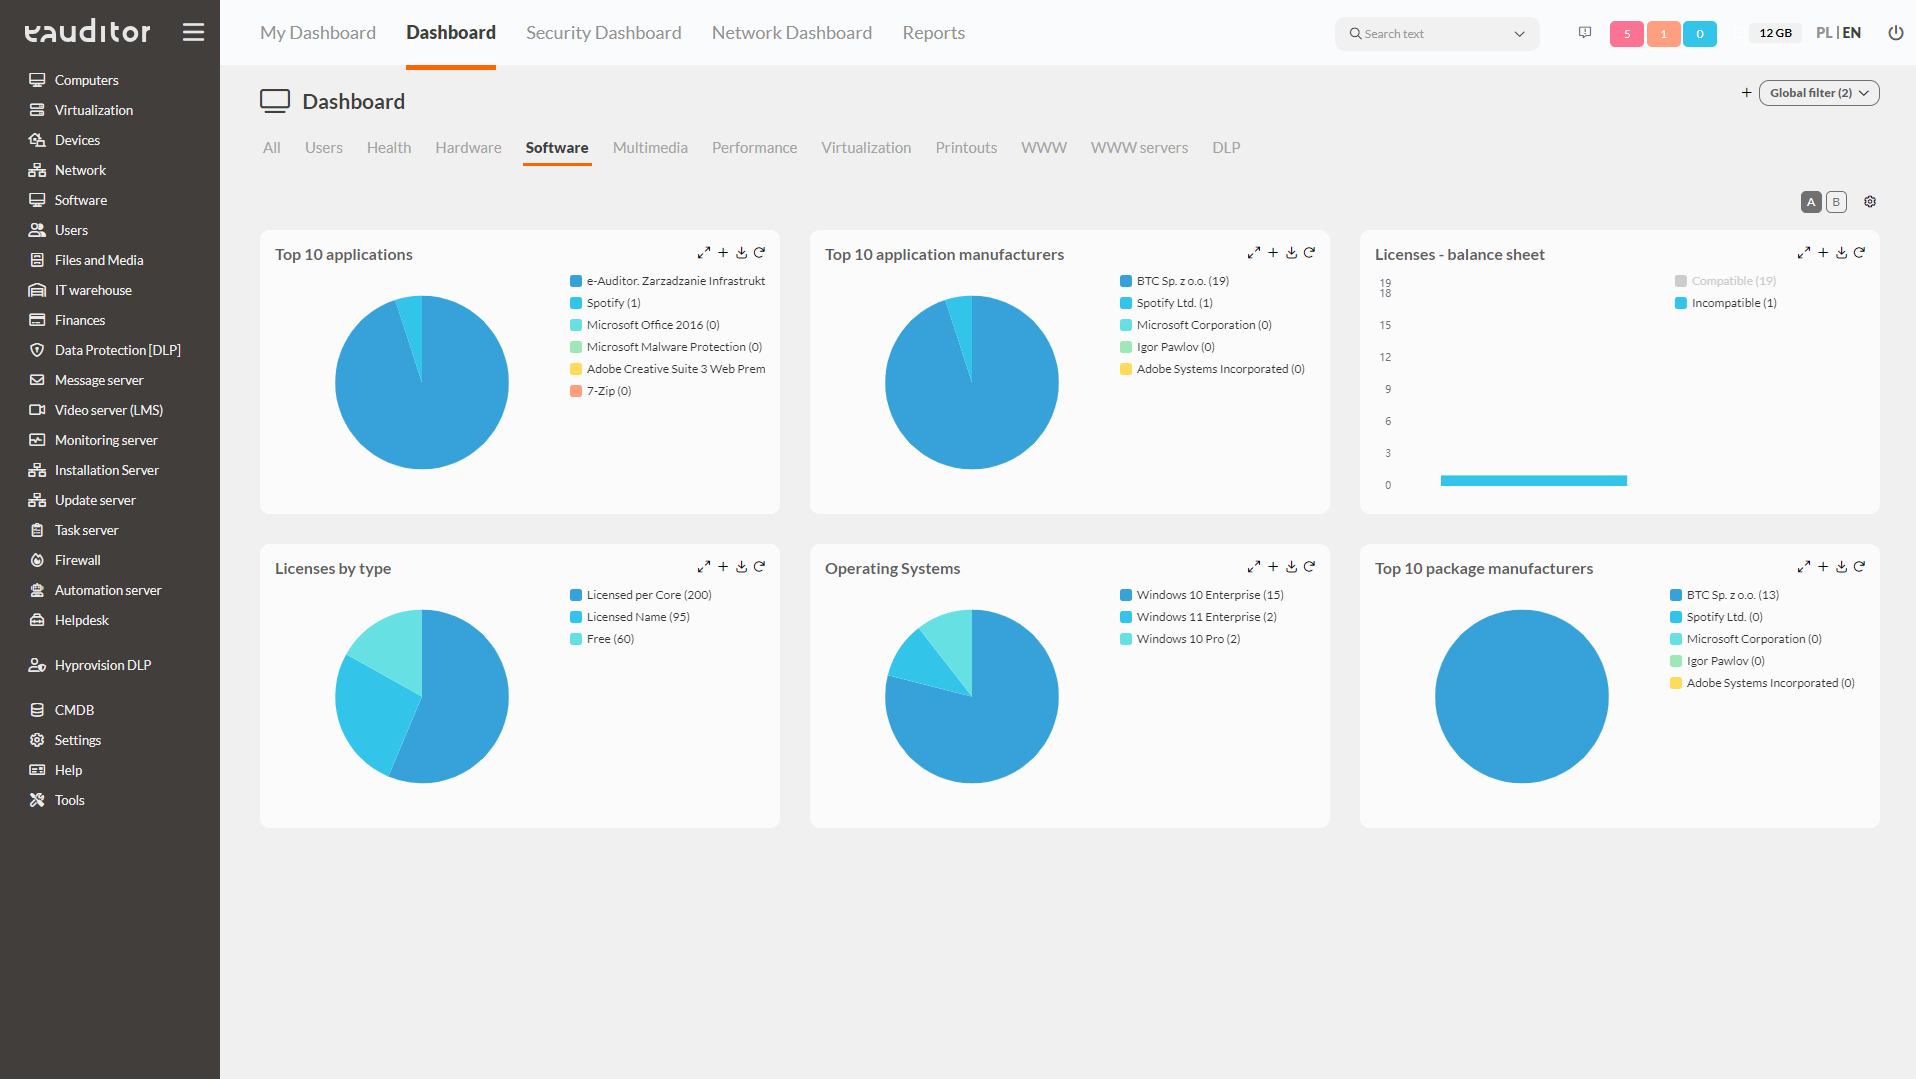
- Software,
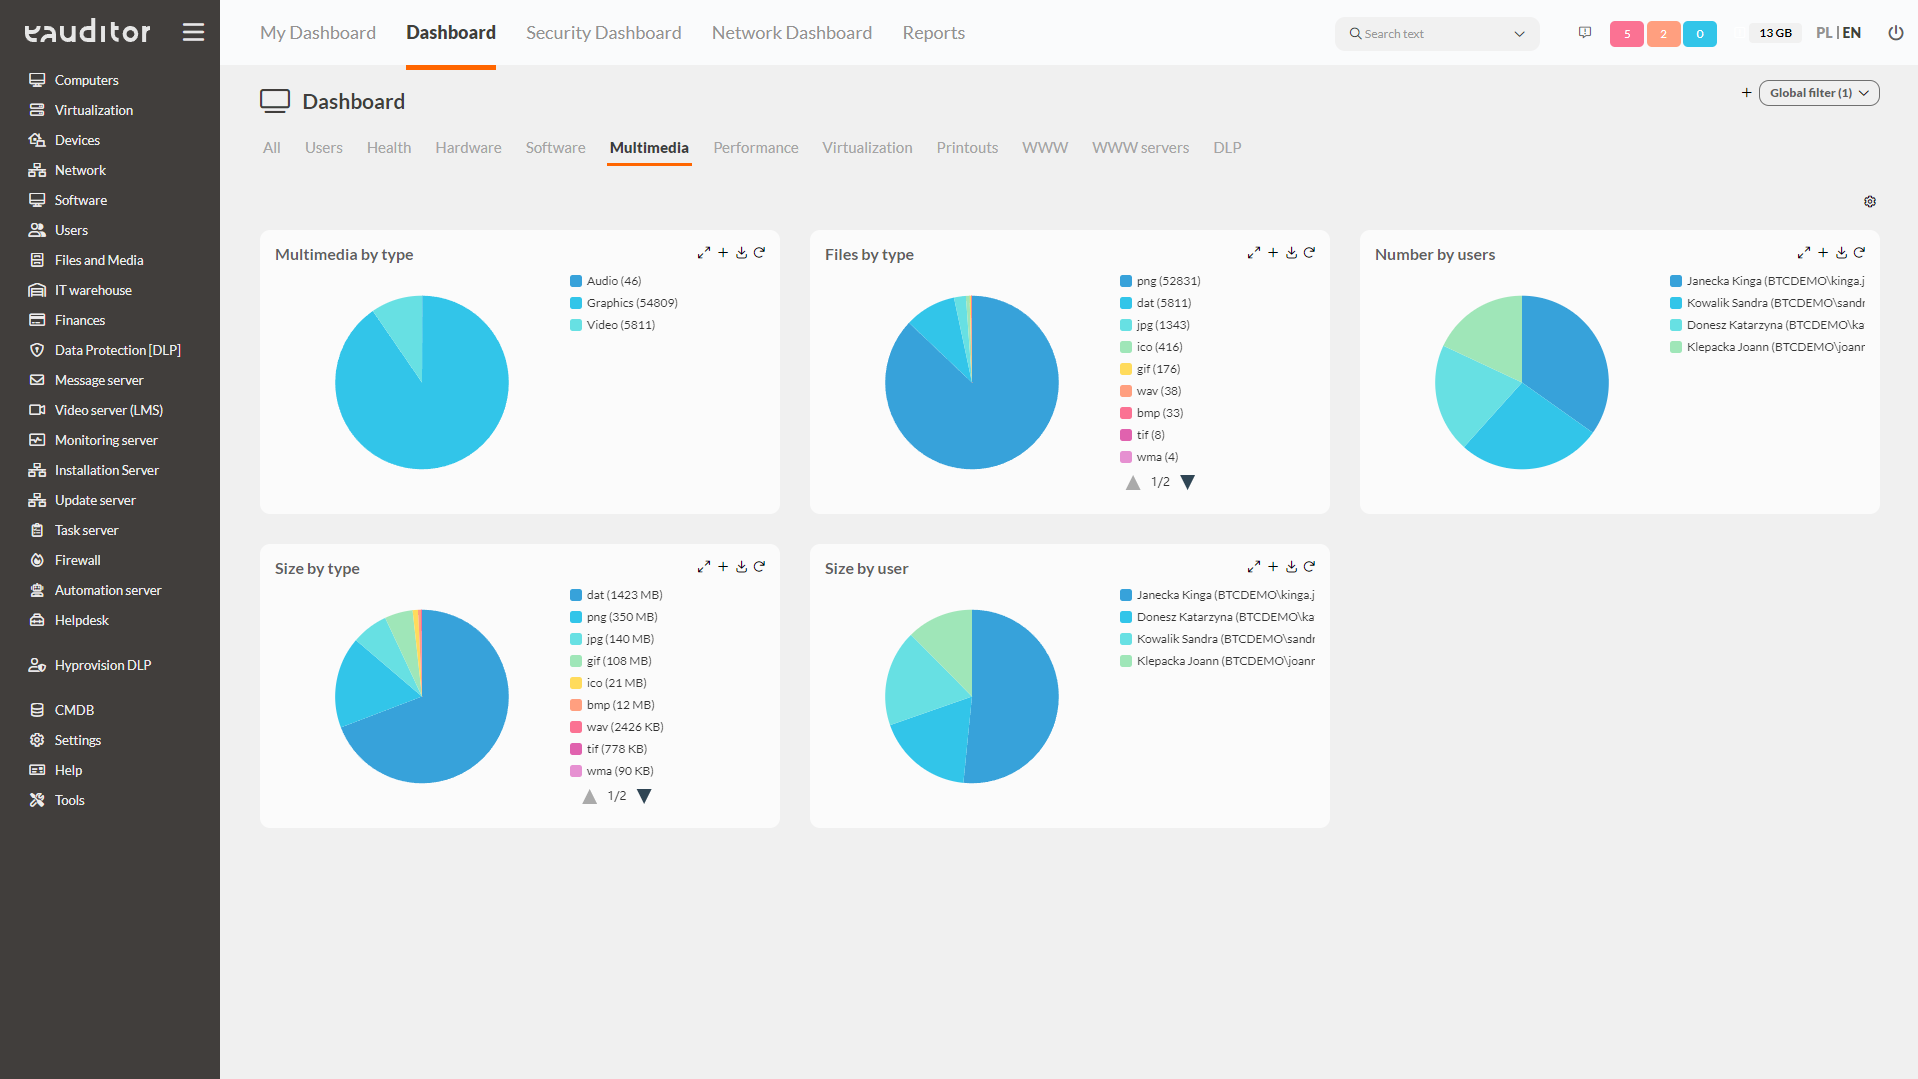
- Multimedia,
- Performance,
- Virtualization,
- Printing,
- WWW,
- Web servers,
- DLP.
This tab contains all information about the current status of IT resources in the organization. This gives the administrator access to the entire IT infrastructure, which he can oversee from a security perspective. In addition, all dashboards are configurable, which means that the administrator can customize them according to his own expectations. This allows him to monitor, for example, applications for their most frequent use by employees in the company.
Benefits
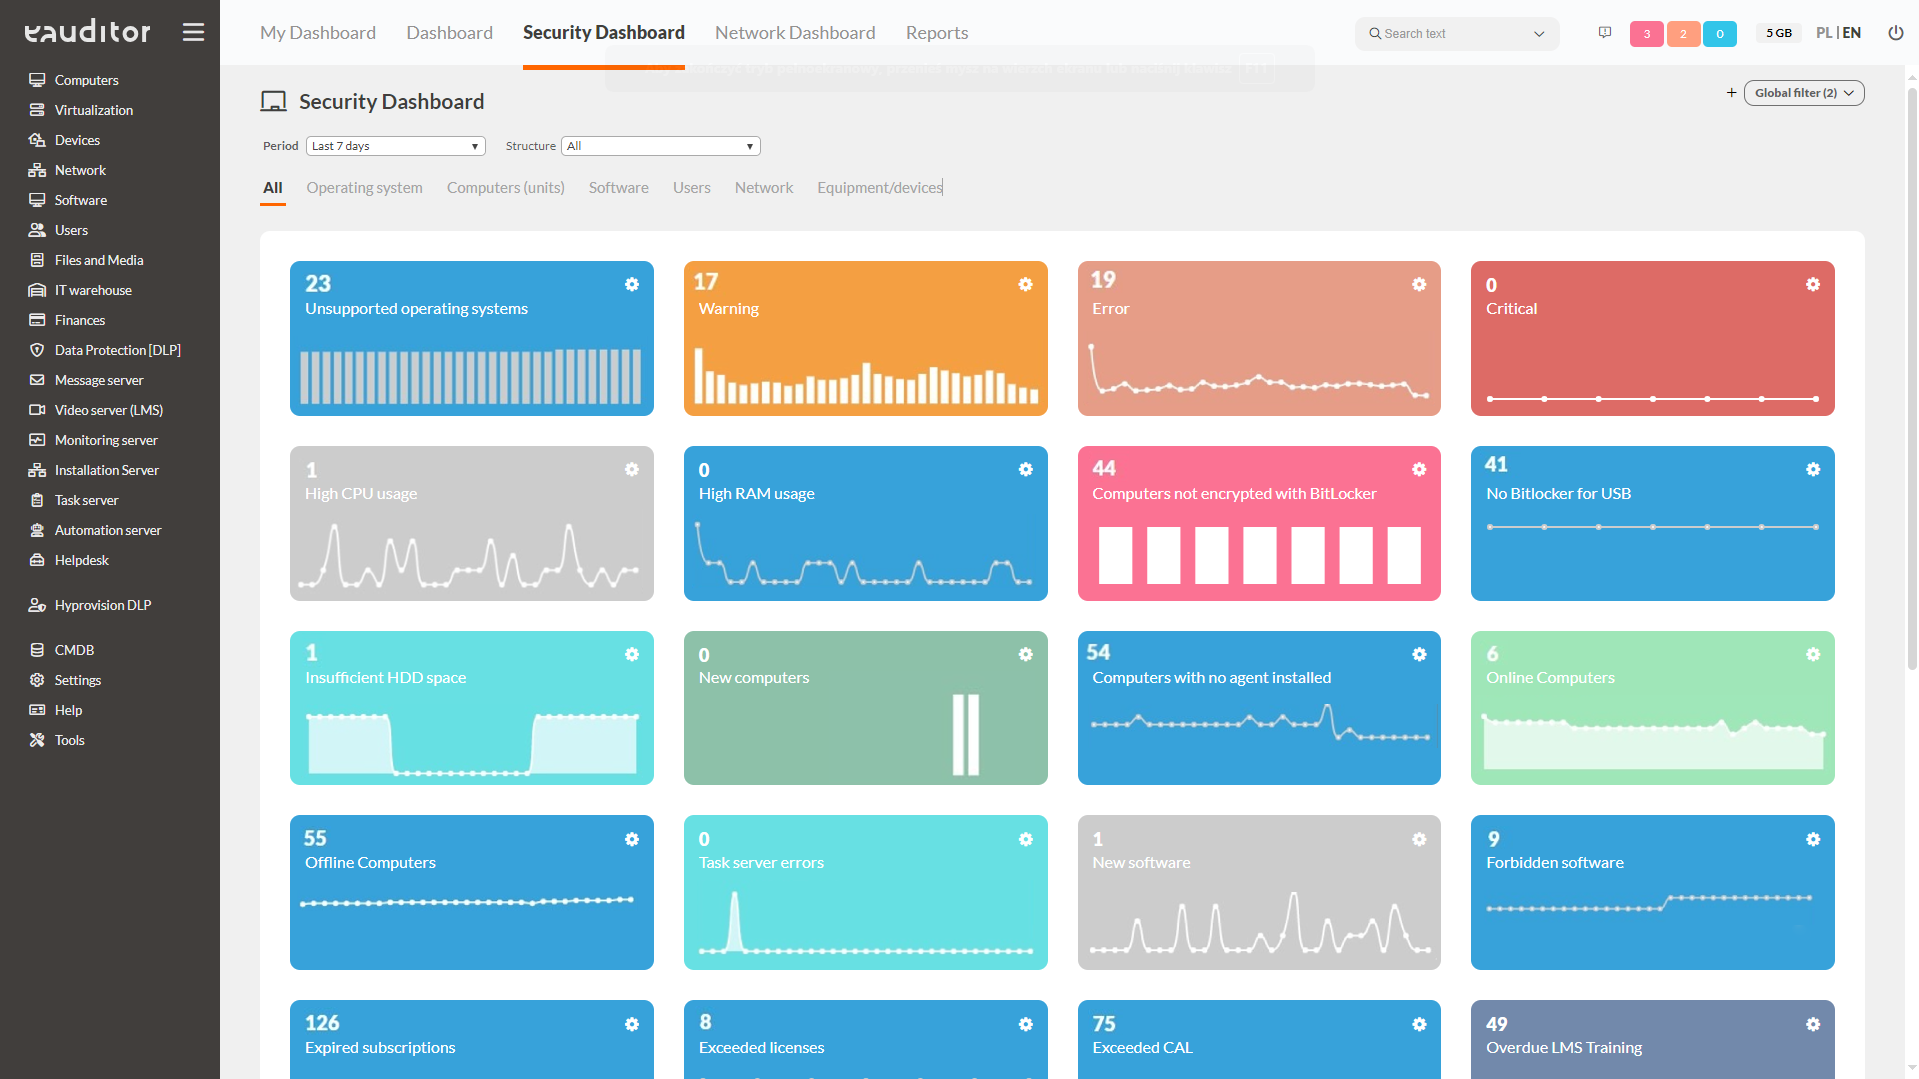
Security Dashboard
Within this view, all information about key indicators of IT infrastructure performance is available. They are grouped by six categories:
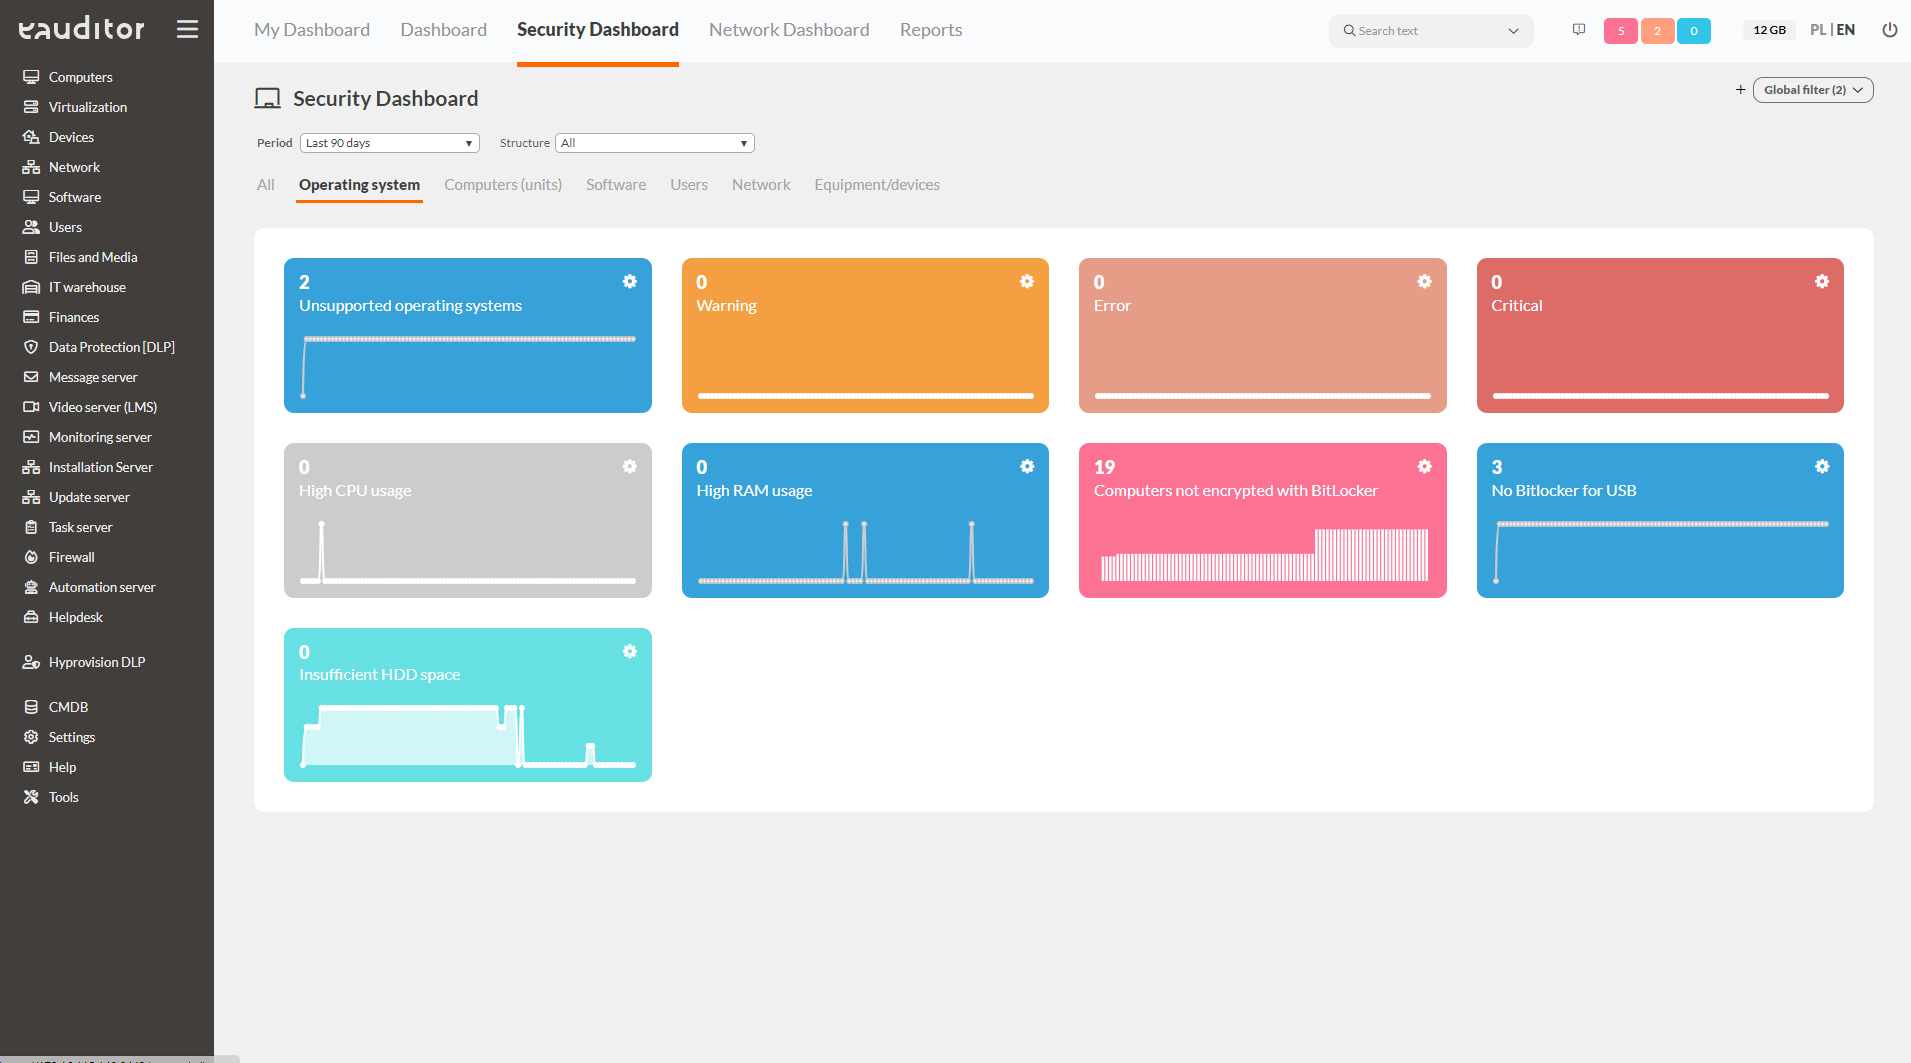
Operating System
This tab presents detailed information on operating systems. The administrator, aiming to maintain security, has insight into the following categories:
- unsupported systems – allows easy verification of outdated operating systems, thus vulnerable, such as data leakage,
- high CPU usage – indicates on how many computers the CPU usage is too high, thus protecting against overloading,
- high RAM usage – indicates on how many computers the RAM exceeds the upper limit of available free operating memory,
- no BitLocker – indicates which computers in a given network do not have a BitLocker encrypted drive,
- too little HDD space – presents which of the computers has too little hard disk space.
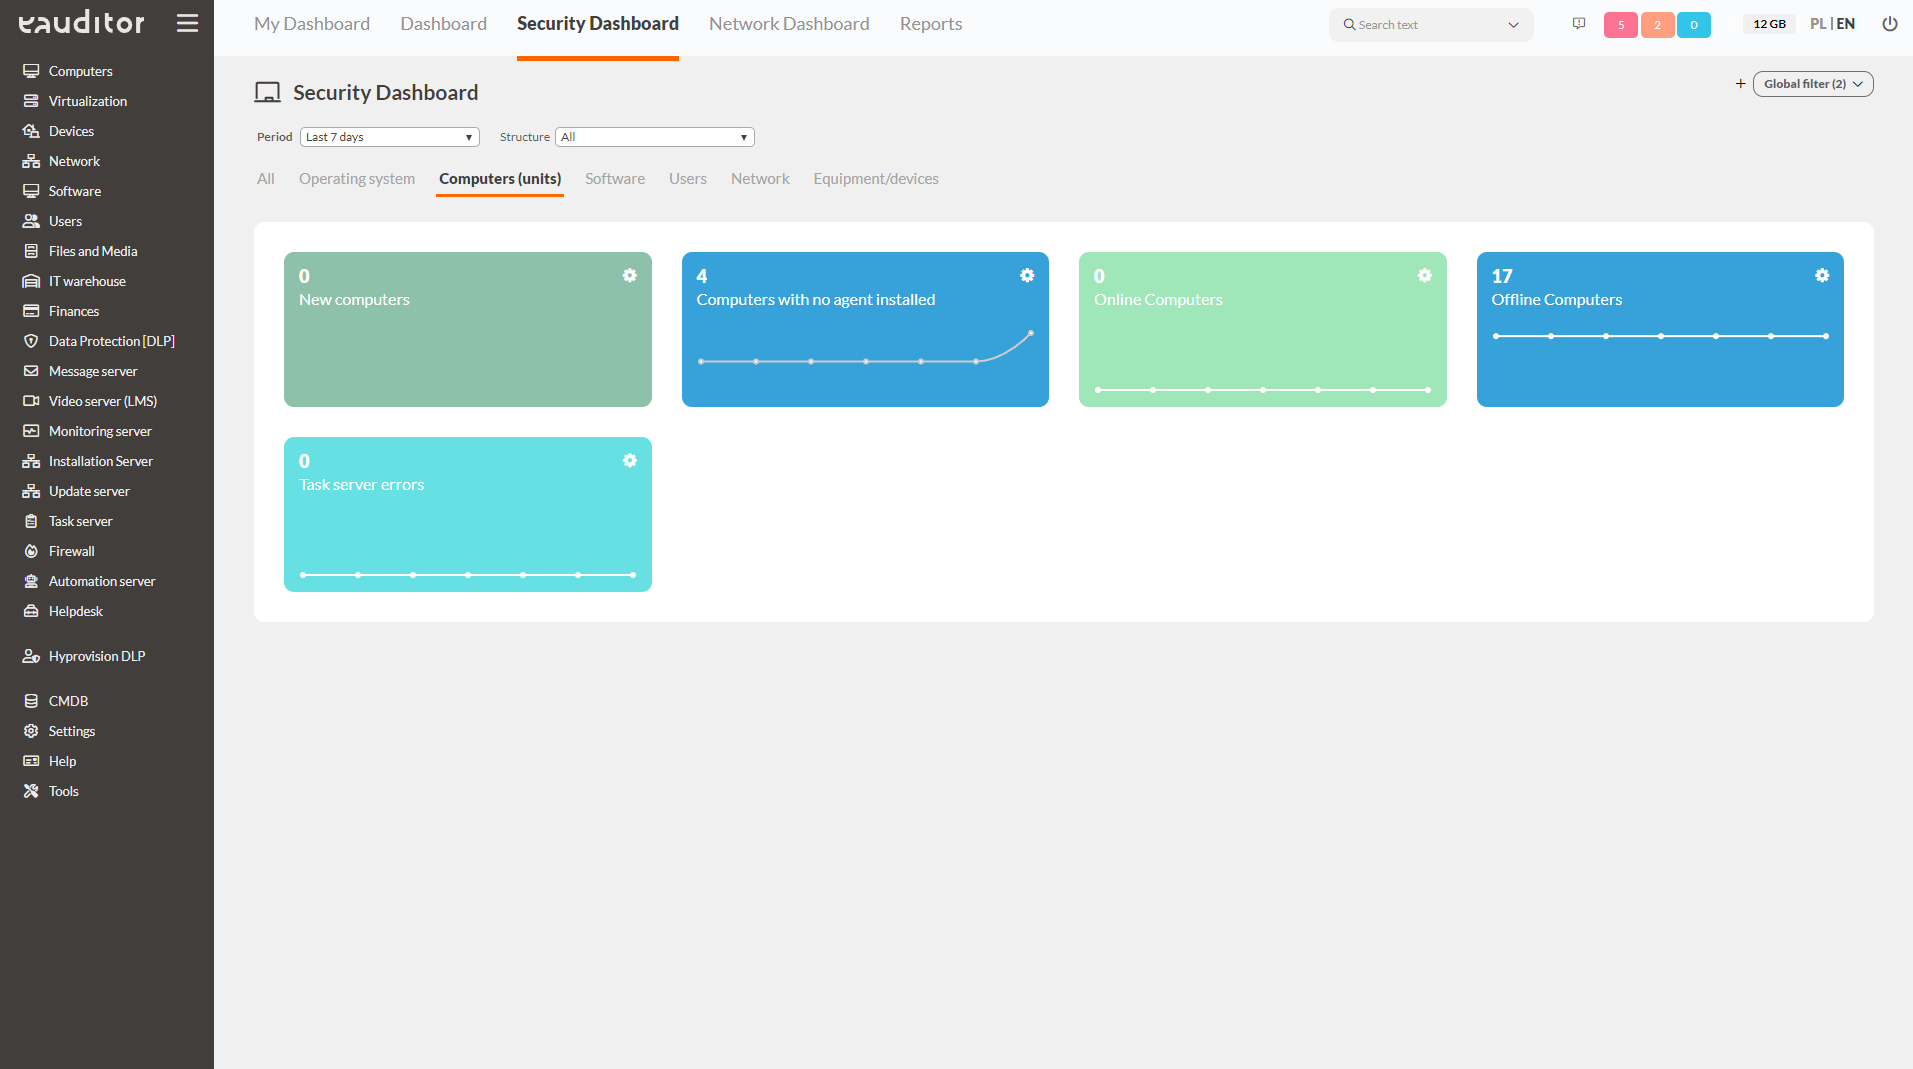
Computers
This tab presents detailed information about computers. The administrator, striving to maintain security, has insight from the following categories:
- online computers – informs about the number of active computers at a certain time,
- offline computers – informs about the number of inactive computers at a certain time,
- task server errors – shows the number of tasks that were not executed correctly on a given day. This allows you to verify and resend the command after it has already been corrected,
- computers without Agent – shows how many computers on a given network do not have agents installed,
- new computers – shows the number of new computers connected to the system on a given day. This makes it possible to identify unauthorized installations of agents on given computers,
- computers with violated DLP policy – shows on how many computers in the system the security policy was violated,
- computers with outdated DLP policy – shows on how many computers in the system there is no current DLP policy installed.
Software
This tab presents detailed information on software. The administrator, striving to maintain security, has insight from the following categories:
- new software – presents information about new software installed on the computer,
- forbidden software – informs about which software installed on computers is forbidden and which is allowed (there is an option to automatically uninstall the software, if any),
- subscriptions that have expired – presents information about which subscriptions installed on computers have expired,
- exceeded licenses – informs about software that does not have a current license. In the system it is possible to compare the amount of installed software against the number of licenses held,
- exceeded ACLs – shows on how many software the CAL license has been exceeded. This makes it possible to react much faster and, for example, to buy a license.
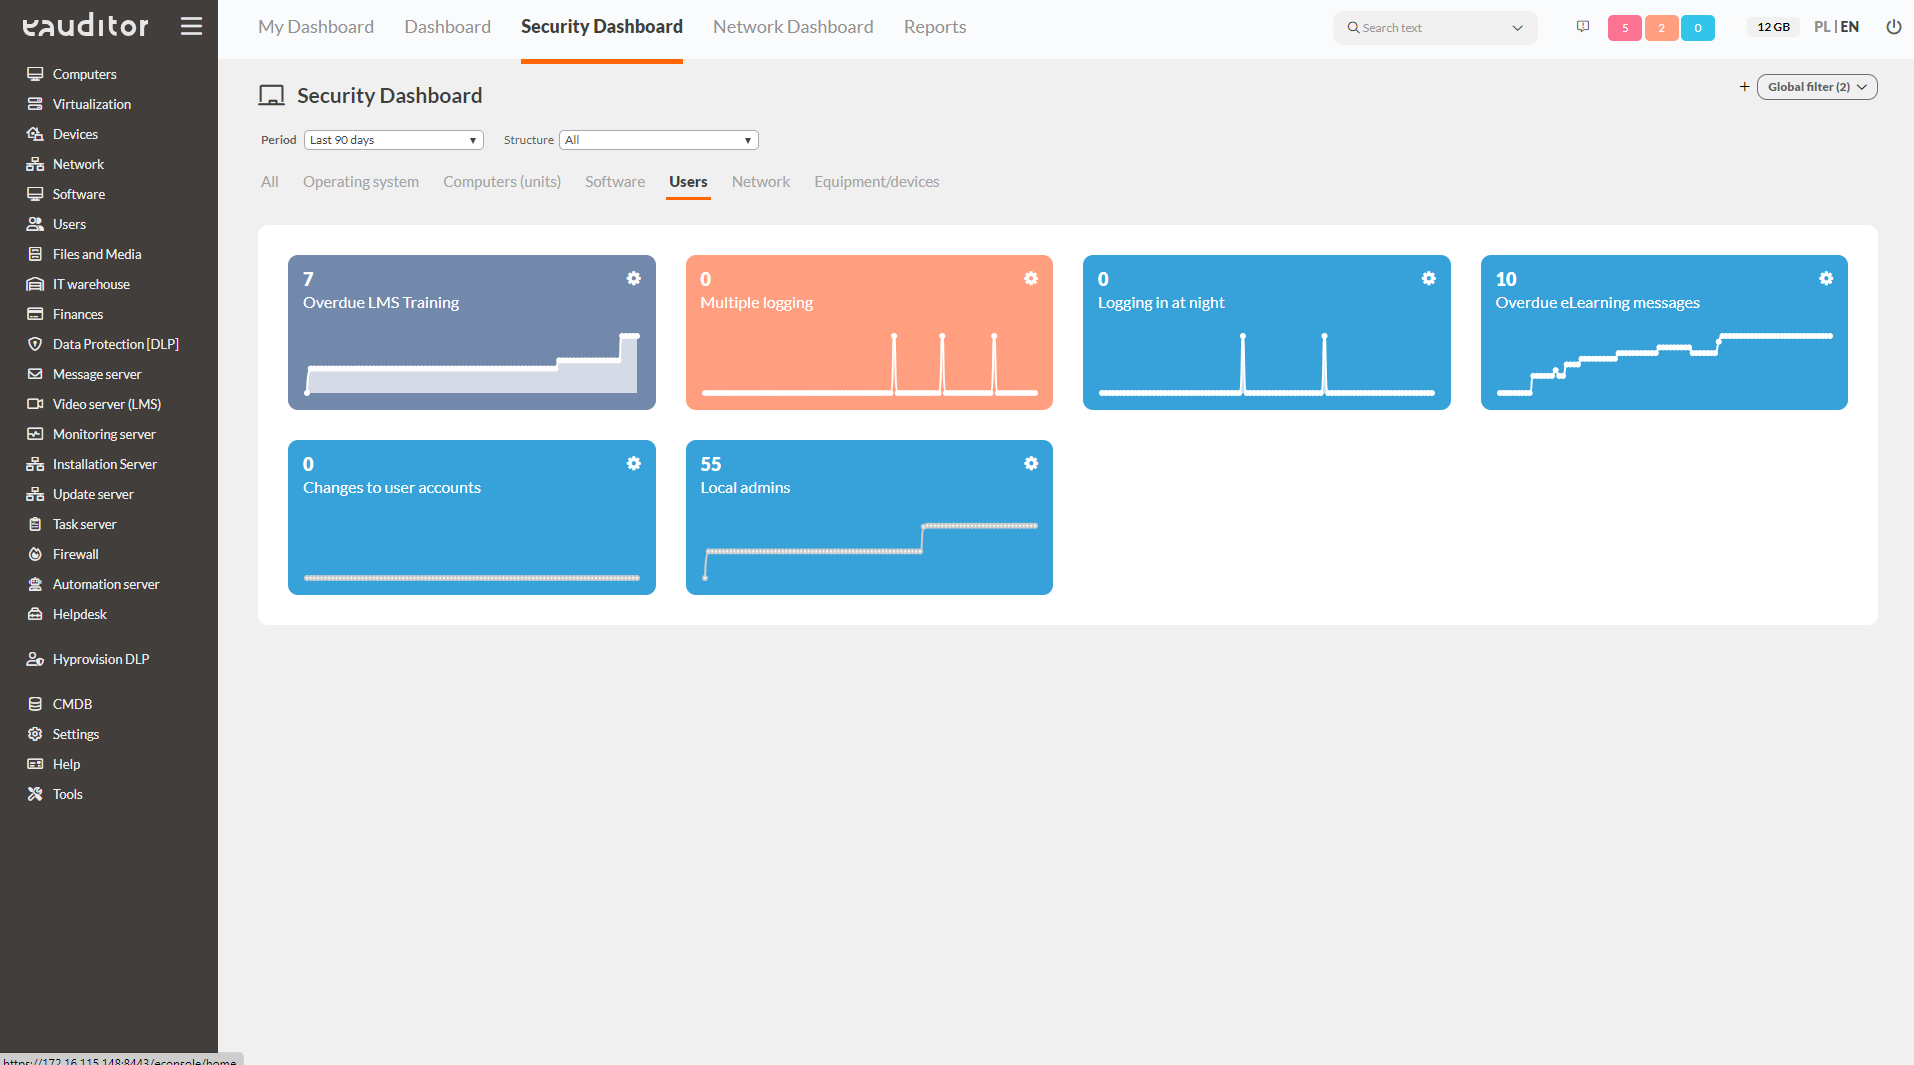
Users
This tab presents detailed information about users. The administrator, striving to maintain security, has insight from the following categories:
- overdue LMS training – shows how many employees have not completed the training to the recommended degree,
- multiple logins – presents how many users are logged in on more than one device on a given day,
- nighttime logins – shows how many employees logged in during hours outside the company’s regular business hours,
- outstanding e-Learning messages – the system allows you to confirm whether and when a user has read the training,
- changes on user accounts – presents the number and type of operations conducted on users/groups that were performed on a given day. This allows you to quickly verify and perform a specific action that can prevent data leaks,
- local administrators – the number of local administrators logged into PC with eAgent.
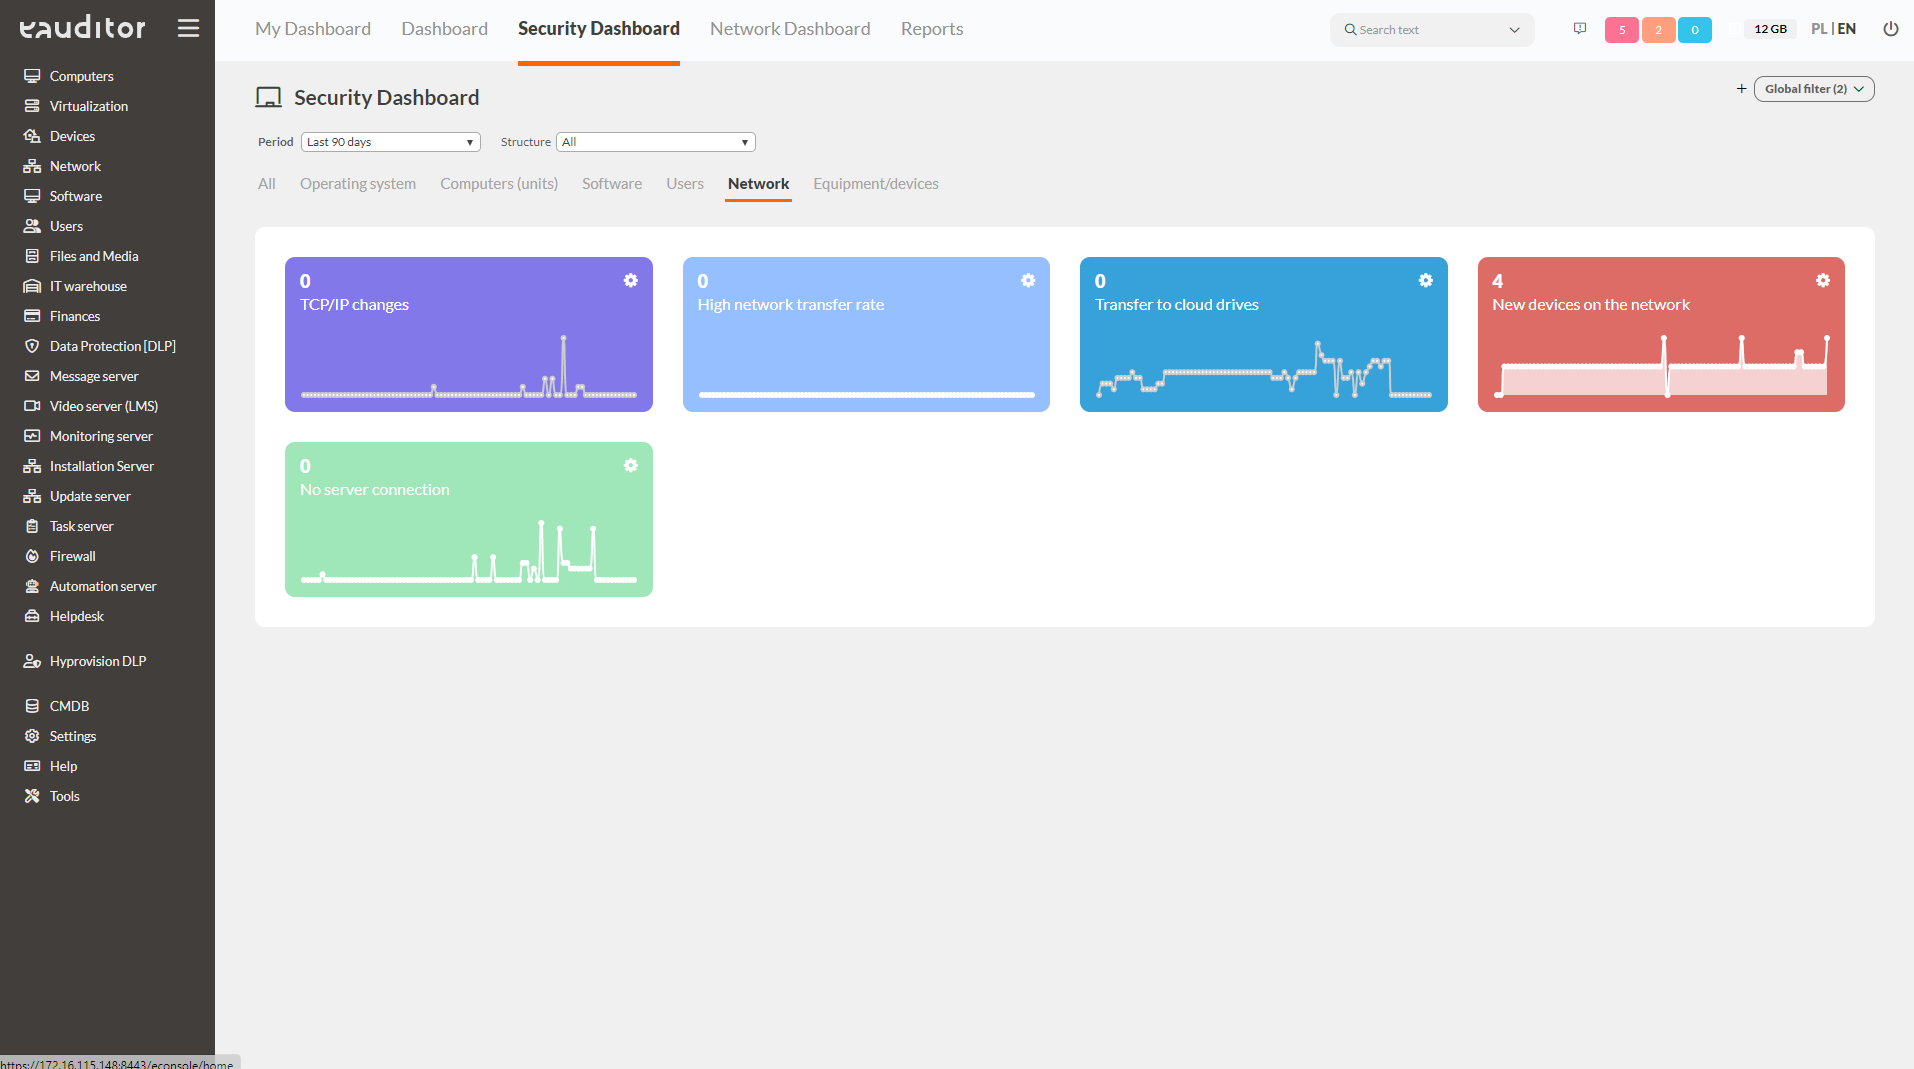
Network
This tab presents detailed information about the network. The administrator, striving to maintain security, has insight from the following categories:
- TCP/IP changes – shows changes from dynamic to static address. This allows the administrator to detect such an incident in a short time and react to it instantly,
- large network transfer – informs on how many computers in a given network the network transfer has exceeded the established safe threshold,
- monitoring of transfer to cloud drives – shows in a simple and clear way the amount of data transferred to hosting services. The administrator can react in time and detect suspicious transfers to the service, effectively reducing the risk of data loss,
- new devices on the network – shows the number of new devices connected to the network on a given day,
- no connection to the server – shows how many computers on a given network the eAuditor system agent has lost connection to the server. This allows the administrator to respond to the incident in a timely manner.
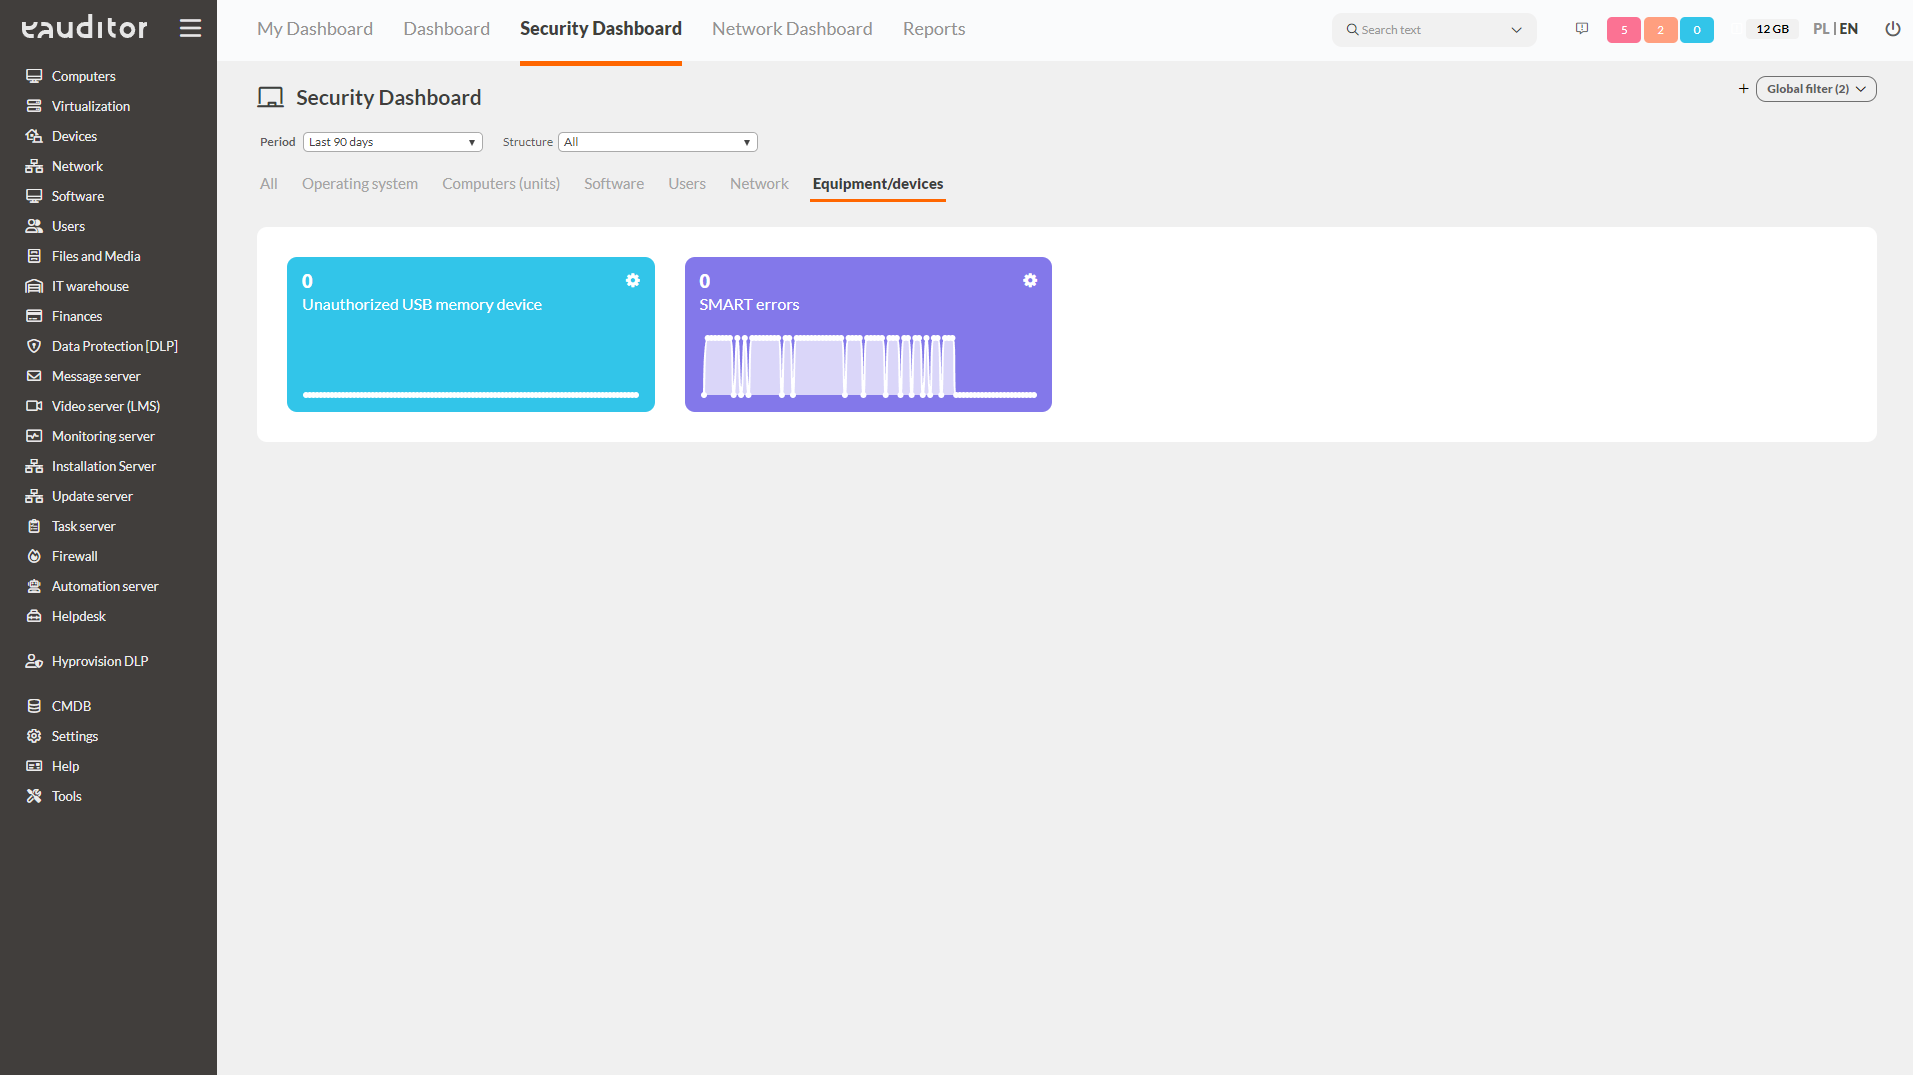
Equipment/devices
This tab presents detailed information about equipment/devices. The administrator, striving to maintain security, has insight from the following categories:
- unauthorized USB memory – indicates the number of detected portable memory devices that have not been accepted by the administrator,
- smart errors – indicates SMART errors on computers connected to the eAuditor system.
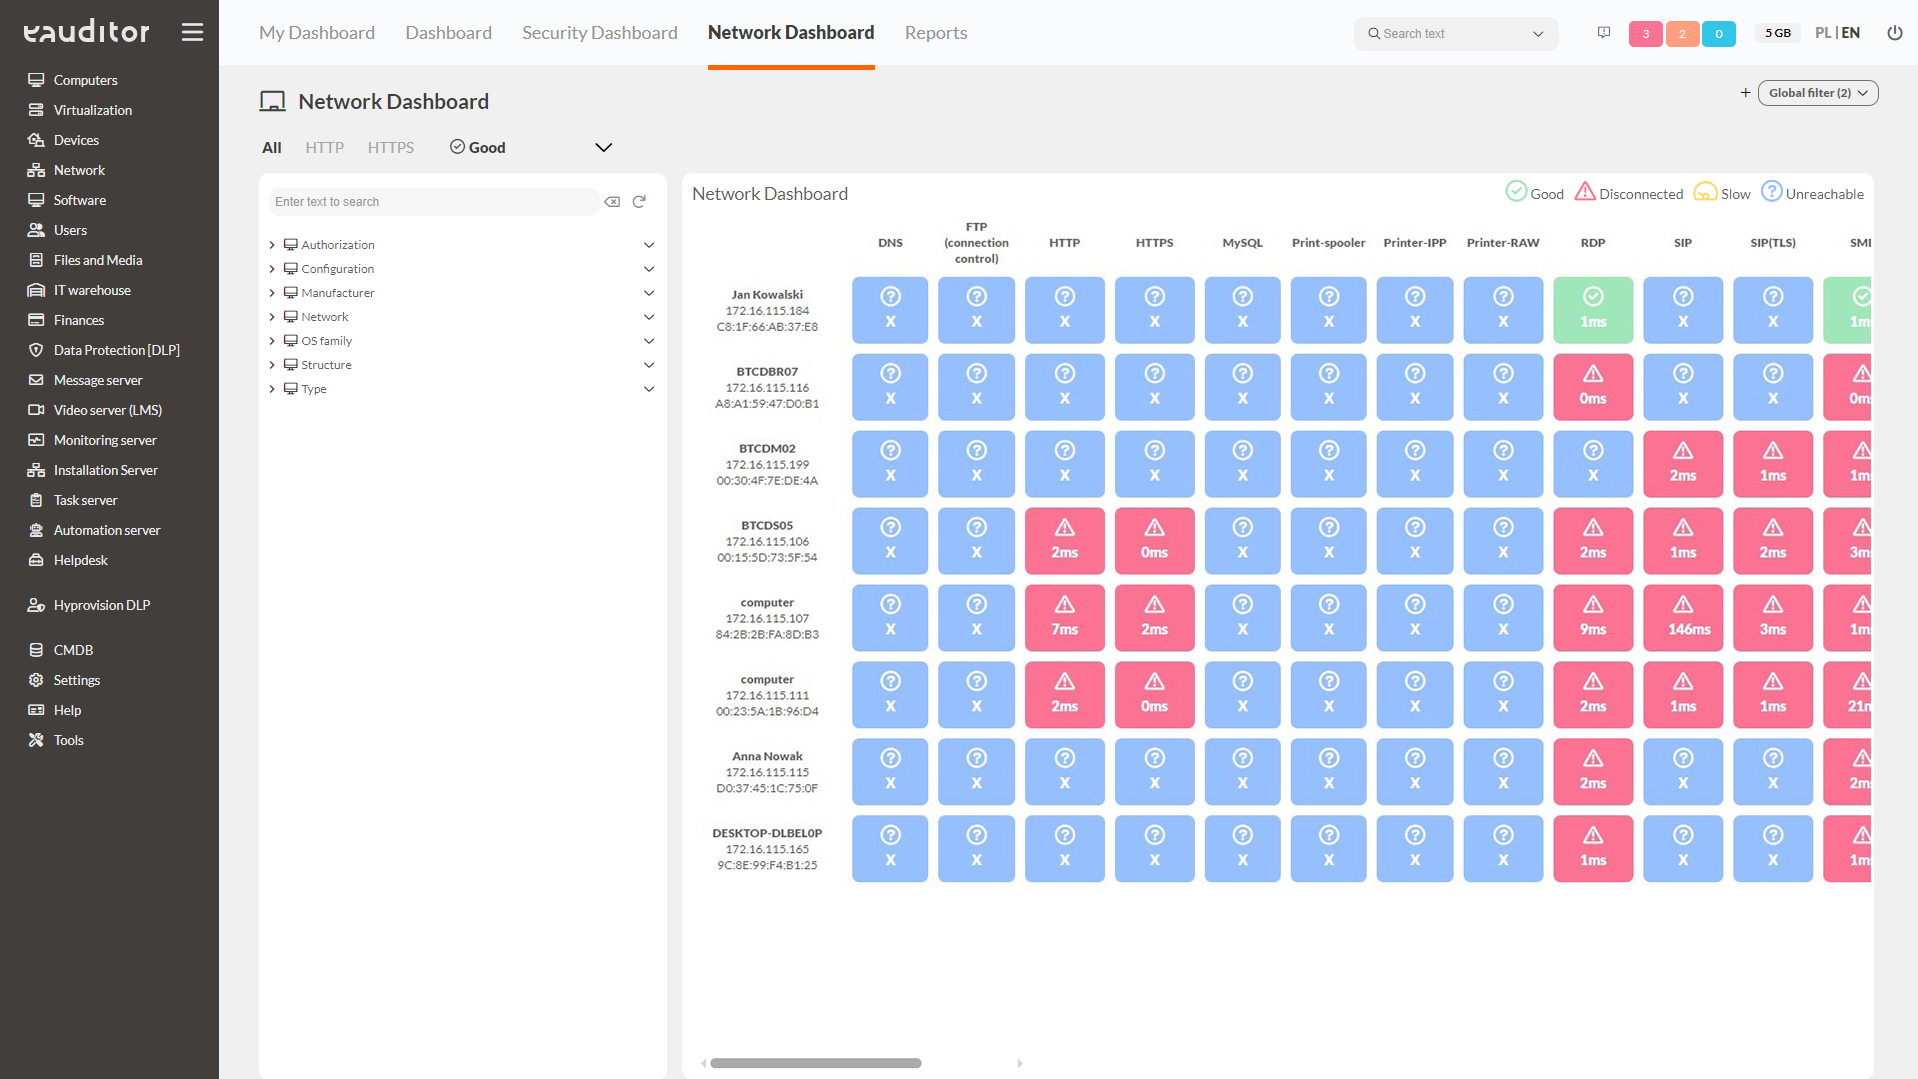
Network Dashboard
The Network Dashboard provides a graphical representation of the connections between devices connected to the network and the services they connect to, along with the recorded average time required to establish that connection. There are four statuses in the system that indicate the connection between a device and a service.
- OK – active connection with the service and the connection time does not exceed the threshold value,
- Slow – active connection with the service, but the connection time exceeds the threshold value,
- Disconnected – yes active connection with the service. The displayed time value is the last historical value for which the connection was obtained,
- Unreachable – no connection to the service.
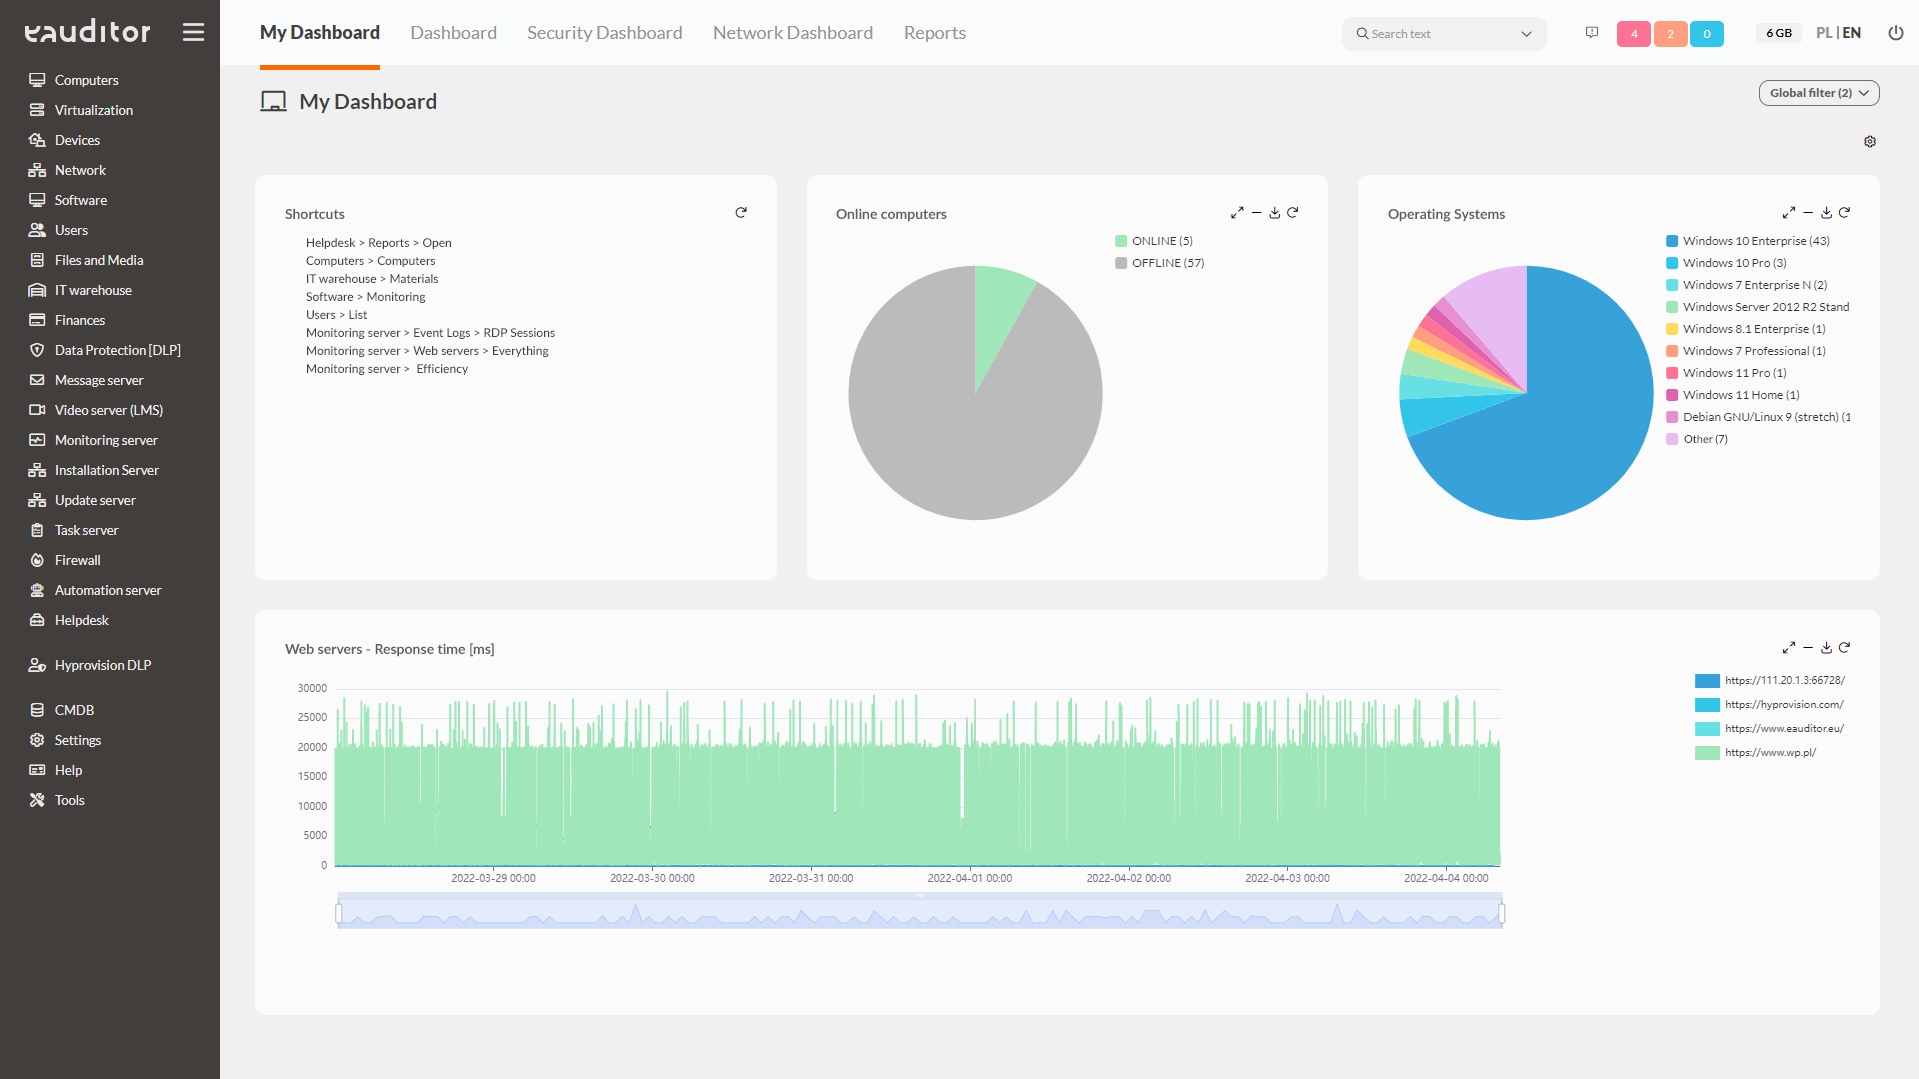
My Dashboard
Within the My Dashboard function, it is possible to create a custom view under a specific system user. This allows administrators dealing with different issues in the organization to get to key information faster. Each of them can copy different widgets from the Dashboard or Security Dashboard sections. In addition, we have shortened the path to reach any console view by allowing the addition of shortcuts. It is now possible to get to the detail tab of the monitored equipment in two clicks.