Server room monitoring
- Various Types of Sensors
- Data Center Incident Alerts
- List of All Sensors
- Historical Data Charts
Table of contents
Server room monitoring
This function allows real-time monitoring and alerting of incidents occurring regarding the health of the organization’s devices. It is designed to oversee the resources and utilization rate of a server or group of servers. Most often, it concerns controlling the main processor, taking into account the environmental conditions in the server room. Monitoring includes, among other things, the air temperature prevailing in the room, humidity or the presence of smoke. This makes it possible to react quickly when malfunctions and disruptions occur in the server room. In addition, the process also makes it possible to prevent the occurrence of potential threats. In a situation where an increase in temperature is observed in a server room, it is possible to quickly identify the source of the problem and thus prevent overheating, for example.
Sensors available as part of this functionality alert you to incidents involving key devices in your organization. It allows you to assign specific devices to a specific location. This makes it possible to remotely monitor, among other things, temperature or humidity levels even in distributed server rooms. This is a great convenience for administrators responsible for their proper functioning. In addition, the eAuditor system allows monitoring of individual parameters in real time from any device, thanks to a web-based console. It informs the user when critical values are exceeded in the server room by sending an e-mail or a message in the system console.
Monitoring the server room in the eAuditor system allows you to see current data, regarding:
- an inventory of all sensors, connected to all devices by status,
- data from all sensors for the last 24 hours.
It presents in detail access to data on connected devices with a map showing location data. These can also be modified. Within the detailed view are presented:
- device information,
- data read from all sensors connected to the device,
- graphs, showing graphically the data read from the sensors, with the possibility to filter them by date.
This functionality also allows access to data on all sensors connected to the network. Filtering is done according to your own criteria. For a more detailed depiction of them, it is possible to change the appearance to a clear table. The detailed view shows:
- details of current sensor readings,
- graphs of the sensor’s historical data with marked areas where the sensor value went beyond the safe range.
- tables including historical data of the sensor.
In the console it is also possible to view statuses showing under which categories the sensor may be. The types of categories are: ok, alarm, abnormal, disabled. These indicate whether the sensor is functioning properly and has connected to the device. If all connected sensors are OK, the device will have an OK status. The situation is the same for alarm or disabled status. The exception, however, is the abnormal status, as it indicates a sensor malfunction. These messages are very useful, as they easily indicate with a single password what state the sensor of the sensor is in. Sensor data is read every minute, but depending on the needs of the administrator this time can be changed. In addition, as part of this functionality, it is possible to freely configure the parameters of the sensor in terms of its name, value or range, among others.
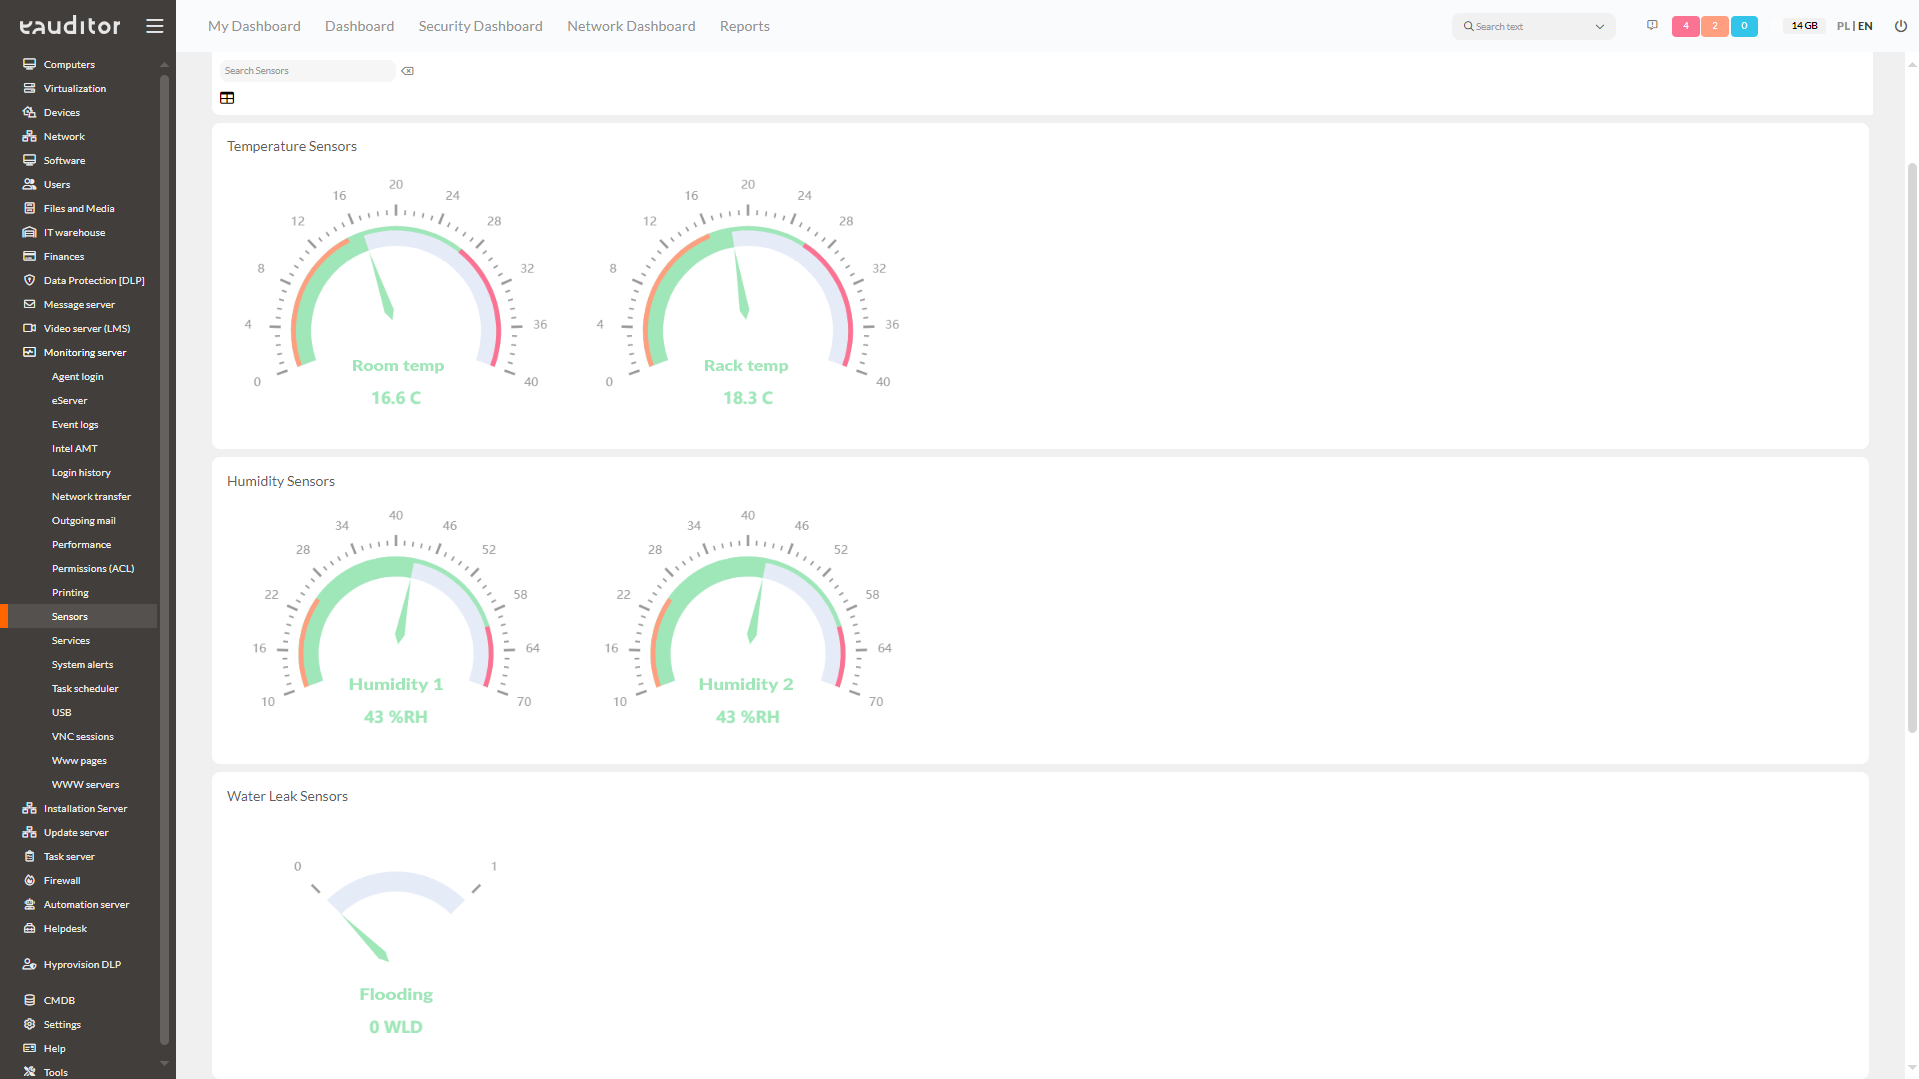
Types of sensors available in the eAuditor system
- Temperature sensor,
- Humidity sensor,
- Water sensor,
- Electric current sensor,
- Electric voltage sensor,
- Light intensity sensor,
- Electric power sensor,
- Dew point temperature sensor,
- Gas leakage sensor,
- Contact sensor,
- Motion sensor,
- Smoke sensor,
- Air flow sensor.
Benefits
Want to learn more about this topic? Read the article “Monitoring the server room”